Medical bankruptcy is a much-debated topic, with most questions focused on exactly how many people file for it and how often it occurs. In 2005, Elizabeth Warren and her colleagues found medical costs led to over 40% of bankruptcies in the United States. This was followed by an update in 2009, pushing the proportion of bankruptcies due to medical expenses to 62%.
The Consumer Financial Protection Bureau’s 2014 report conflicts with this, citing that less than 1% of US adults file for bankruptcy even though 20% of the population has great medical debt. A group of economists recently reexamined this issue, concerned that the discrepancies in statistics were causing a misunderstanding of the problem. They studied a group of patients at a California hospital and looked at how hospital visits related to bankruptcy timing.
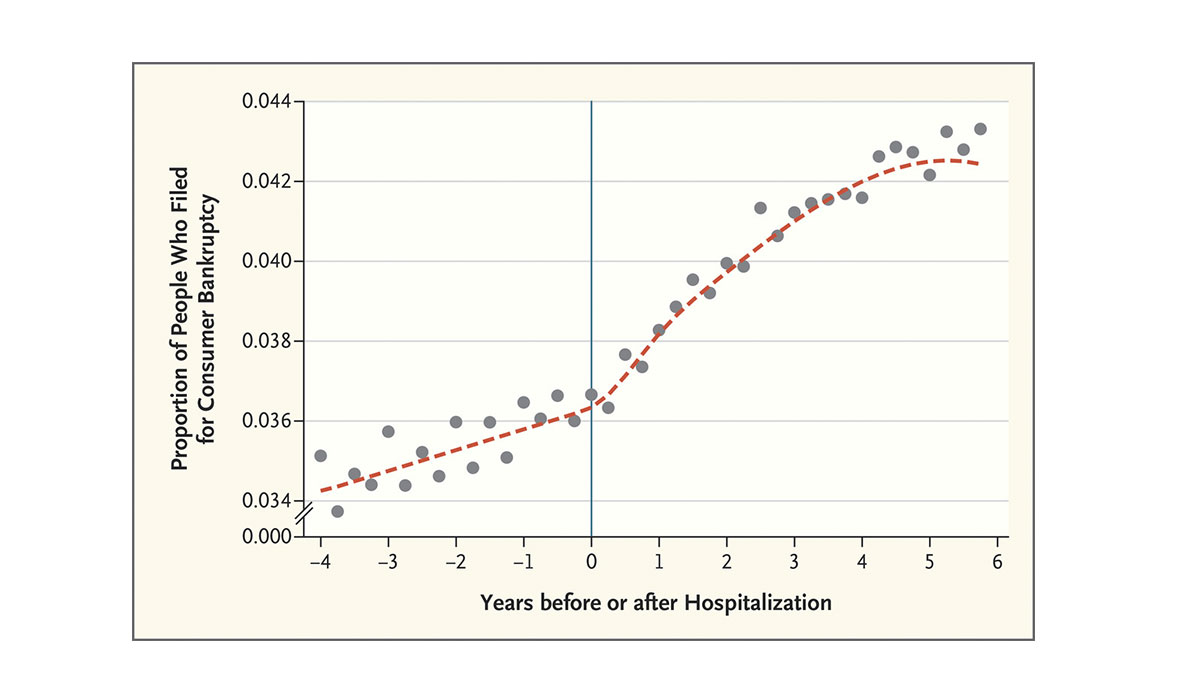
The image above shows an increase in people filing for bankruptcy after hospitalization, particularly between one and four years after admission. The researchers suggest that paying for medical bills out of pocket, and losing income because of missed work are key reasons people file for personal bankruptcy. The graph also shows, however, that only 4% of the bankruptcies were related to hospitalization, an association of much smaller magnitude than previously understood.
Warren and colleagues critiqued the economists’ research, stating that focusing only on hospitalization does not account for other medical experiences and expenses like spending time and money in emergency departments, and paying for chronic illness treatments. The economists’ subsequent response argued that estimating a causal relationship requires focusing on an isolated factor, like hospitalization.
Databyte via Carlos Dobkin, Amy Finkelstein, Raymond Kluender, and Matthew J. Notowidigdo, Myth and Measurement — The Case of Medical Bankruptcies. New England Journal of Medicine.