Traditionally, poverty has been regarded as the income shortfall of an individual. However, income levels do not accurately reflect quality of life. The official poverty measure in the U.S. has been criticized for being outdated. Despite having income above a poverty threshold, an individual may still be deprived in other dimensions such as education, housing, or health. When an individual suffers multiple such deprivations at the same time, the consequences for quality of life far exceed the sum of each separate deprivation.
In 2010 the annual United Nations Human Development Report started publishing a multidimensional poverty index for more than 100 developing countries. This instrument makes it possible to measure the impact of multiple forms of deprivation on wellbeing.
My colleague, Robert Haveman, and I conducted a comprehensive analysis of multidimensional poverty in the U.S. from 2008 to 2019. We estimate multidimensional poverty for the first time in four regions and all 50 states for each year. This study builds on my previously published research on multidimensional poverty during the COVID pandemic, during the Great Recession, among senior citizens, and across racial and ethnic groups.
We used data from the U.S. Census Bureau’s American Community Survey (ACS). The ACS is the largest household survey, comprising more than 3 million individuals. For each individual in the sample, we compile data on six quality-of-life indicators, namely, health, education, economic security, standard of living, social connections, and housing quality. Each year, a person is identified as being multidimensional poor if that person is deprived in two or more of the six indicators. We estimated a headcount index which shows the percentage of the multidimensional poor in the population, and we analyzed other indices which estimate the extent of compounding deprivation.
At the peak of the recession, more than 15% of the population was multidimensional poor.
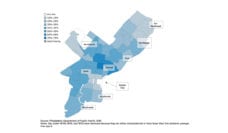
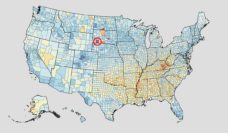
Trends in multiple indices were consistent over years. Multidimensional poverty increased during the Great Recession (2008–2010) and thereafter declined gradually (2011-2019). At the peak of the recession, more than 15% of the population was multidimensional poor. Multidimensional poverty was highly prevalent in the South and the West, particularly in California, Texas and Florida.
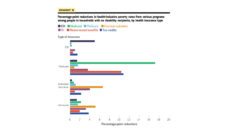
On average, 13% of non-elderly adults were multidimensional poor. This means they were deprived in two or more quality-of-life indicators and about 12.5% were income poor — that is, their income was below the poverty threshold. Yet we found only a small overlap between the two groups. Only 5.5% were both income poor and multidimensional poor. Among individuals who were not income poor, deprivation was highest among individuals with incomes just above the poverty threshold.
Most people living in multidimensional poverty lacked health insurance and a high school education. They also faced a severe housing cost burden. At the peak of the recession, more than 21% of adults had no health insurance. But, by 2018, this proportion decreased to 12%. Multidimensional poverty was much higher among Hispanic and foreign-born individuals.
Our analysis makes a strong case that poverty in the U.S. should be evaluated using indicators that capture deprivation beyond income. Policies geared towards reducing income poverty preclude those who do not qualify as income poor. Yet these individuals have suffered multiple deprivations, especially during the recession. In the future, we need policies that help people who are income poor and multidimensional poor. As the country recovers from the pandemic, it will be even more important to monitor multidimensional poverty. We must do this in conjunction with income poverty in order to get a better idea of the impact on quality of life.
Photo via Getty Images