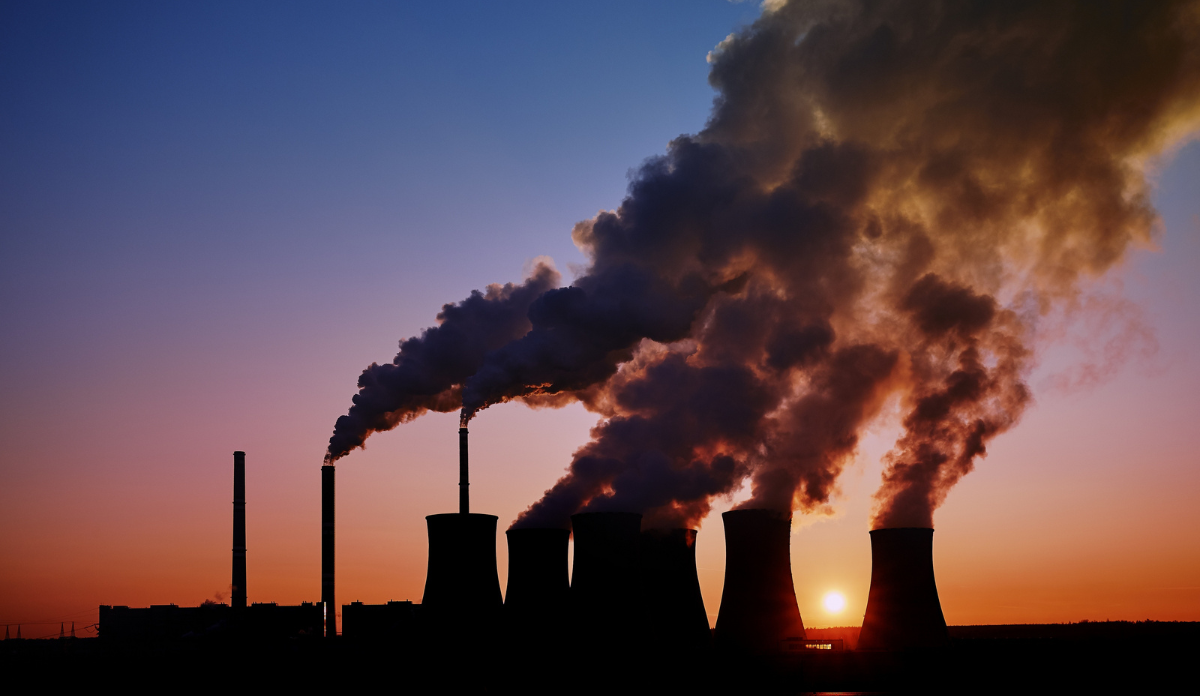
Manufacturing facilities, mining sites, and even electric power plants emit toxic air pollutants. This industrial air pollution often carries negative health consequences for people who are exposed. Yet the risk of exposure is not equal across the United States. My colleagues and I conducted a study to measure exposure to industrial air pollution across different neighborhoods.
Exposure to air pollution differs widely across neighborhoods based on racial makeup, income level, and urban or rural location. This difference is stark. We found a 45-fold difference between the most and least exposed neighborhoods.
Activists and previous researchers have drawn attention to the ways in which communities of color and poor neighborhoods experience greater exposure to environmental problems such as air pollution and water contamination—also known as environmental injustices. We wanted to know if air pollution exposure is higher for communities facing multiple forms of injustice. Our study incorporates data from the Environmental Protection Agency and the American Community Survey on neighborhoods across the U.S. to answer this question.
We used a novel statistical approach that operationalizes the Black feminist theory of intersectionality to holistically assess air pollution exposure. Intersectionality is a framework that highlights how singular approaches to systems of power, focused on a single “ism” such as racism or classism, are incapable of capturing the burdens of communities with multiply marginalized populations. An intersectional approach focuses on the interlocking, mutually constituted nature of systems of oppression and privilege such as racism, patriarchy, and classism. Estimating multiplicative effects raises unique challenges in conventional quantitative approaches.
This clearly demonstrates that pollution inequalities are not based on a single demographic factor but rather multiple, overlapping, social and economic inequalities.
In statistics, one common way to apply an intersectional approach is by using an interaction between variables a and b to test whether variable a changes the effect that variable b has on the outcome. For example, does a Black (variable a) woman (variable b) experience greater racism because of her gender? Does she experience greater sexism because of her race?
When studying multiple social dimensions at once (for example, race, income, and education level), the number of categories of each variable is multiplied and placed within the equation. Such an approach produces an equation with many interaction terms, which can lead to inefficient, uninterpretable results.
You can imagine statistical models as an input-output machine. In previous intersectional work, researchers would place more units into the machine. Rather than placing more interactions into the equation as described above, we integrate the interactions into the statistical modeling structure itself. In other words, we changed the machine. This allows us to examine multiple social dimensions without compromising the interpretability of the results. We refer to this innovative approach as eco-intersectional multilevel modeling (EIM).
We found that lower-income urban neighborhoods with a high percentage of Black residents and female-headed households experienced the most exposure. In comparison, higher-income neighborhoods with a high percentage of White residents and fewer female-headed households experienced the least exposure. This clearly demonstrates that pollution inequalities are not based on a single demographic factor but rather multiple, overlapping, social and economic inequalities.
Our study emphasizes the importance of using an intersectional approach to better understand the air pollution exposure gap. Our findings also have important public health policy implications that can inform regulatory decision-making. This work supports the development of cumulative impact screening tools which can reveal important patterning in exposure levels. For example, the CalEnviroScreen maps environmental exposure, health outcomes, and socio-demographic characteristics to identify cumulative impacts in California. We hope our findings will be useful for environmental justice and antiracist advocates to support community initiatives and dismantle unjust policies.
Photo via Getty Images