The environment has been altered by Covid-19 through stay-at-home orders and restrictions on travel. We conducted a systematic study using satellite observations, ground-based in-situ sensors, and other infrastructural observations to understand how the pandemic has impacted the short-term environmental patterns in China, California, and worldwide.
As shown in Figure 1, air pollution in China dropped by up to 20% due to lockdown policies and strictly implemented travel bans during the first surge of the virus. The reductions are especially apparent for the regions with normal heavy pollution such as China’s Shanxi and Shandong provinces, where large numbers of coal power plants operate.
The US also experienced similar reductions in air pollution due to lockdown restrictions. Figure 2 shows that regional patterns similar to those in China also occurred along the national highway between Los Angeles and San Francisco where traffic was greatly reduced due to lockdown.
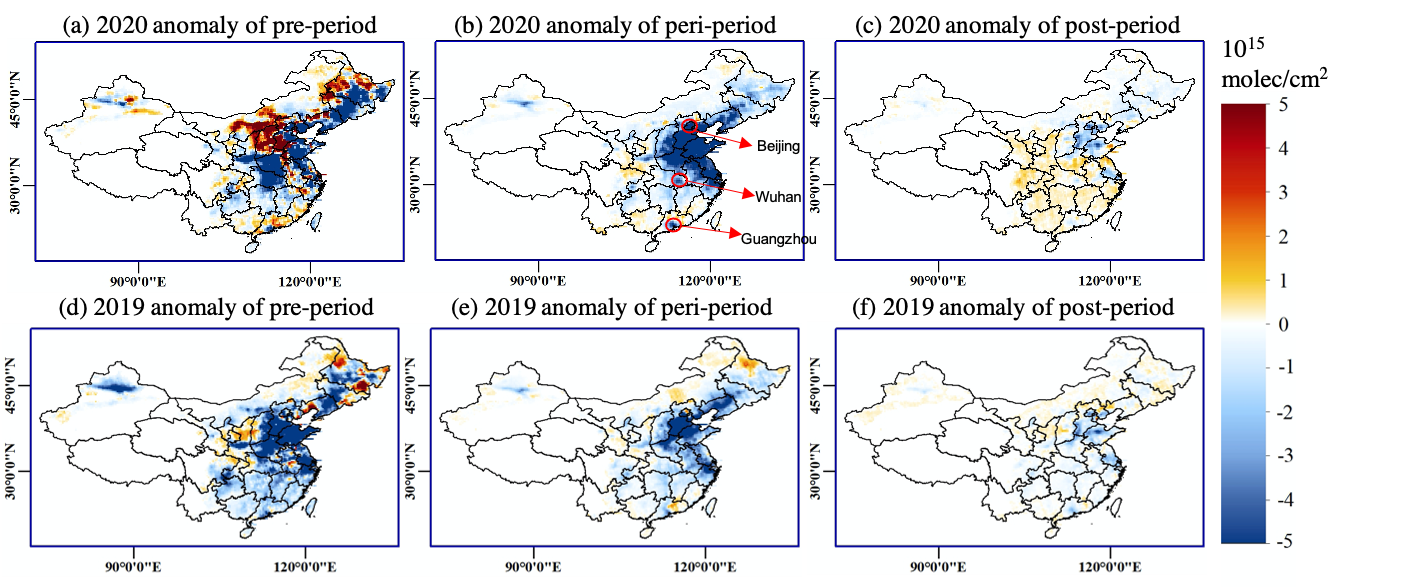 Figure 1. Spatial patterns of NO2 TVCD anomalies for pre-, peri- and post-period over China. (a)~(c) anomalies for 2019; (d)~(f) anomalies for 2020. Red circles are cities of Beijing, Wuhan and Guangzhou. Pixels with annual means smaller than 1 x 10¹⁵ molec/cm2 are not plotted in the maps.
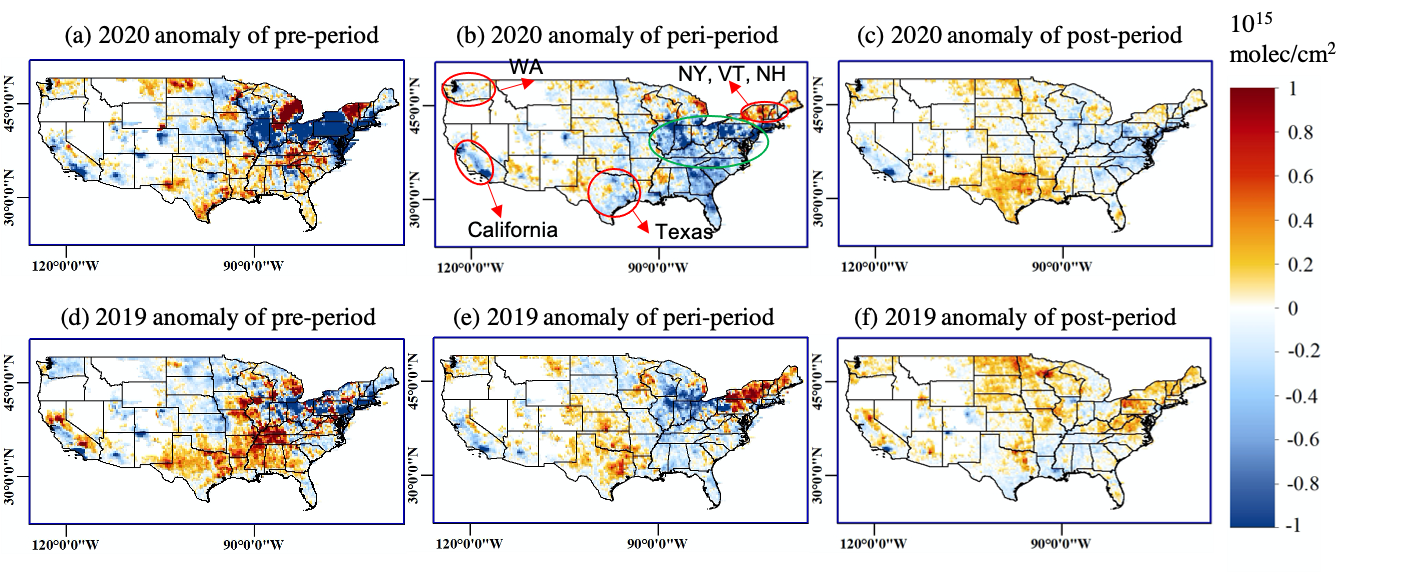 Figure 2. Spatial patterns of NO2 TVCD anomalies for pre-, peri- and post-period over the US. (a)~(c) anomalies for 2019; (d)~(f) anomalies for 2020. Red circles are cities of Beijing, Wuhan and Guangzhou. Pixels with annual means smaller than 1 x 10¹⁵ molec/cm2 are not plotted in the maps.
Figure 3 shows the spatiotemporal patterns for the air pollution change in China. The daily time series of January 2020 reveals a continuous decrease, reaching its lowest point around January 25, the Chinese New Year, due to the gradual shutdown of industry prior to the country’s biggest holiday. This is consistent with the data of 2019 and 2010-2019. One week after the New Year, a rebound in air pollution was detected between 2010 and 2019 as the holiday period ended.
In 2020, the time-series did not display such a rapid uptick. Atmospheric nitrogen dioxide (NO2) stayed low until about 20 days after the Chinese New Year and returned to normal much more slowly than in previous years. This pollution period was prolonged by more than 40 days in 2020.
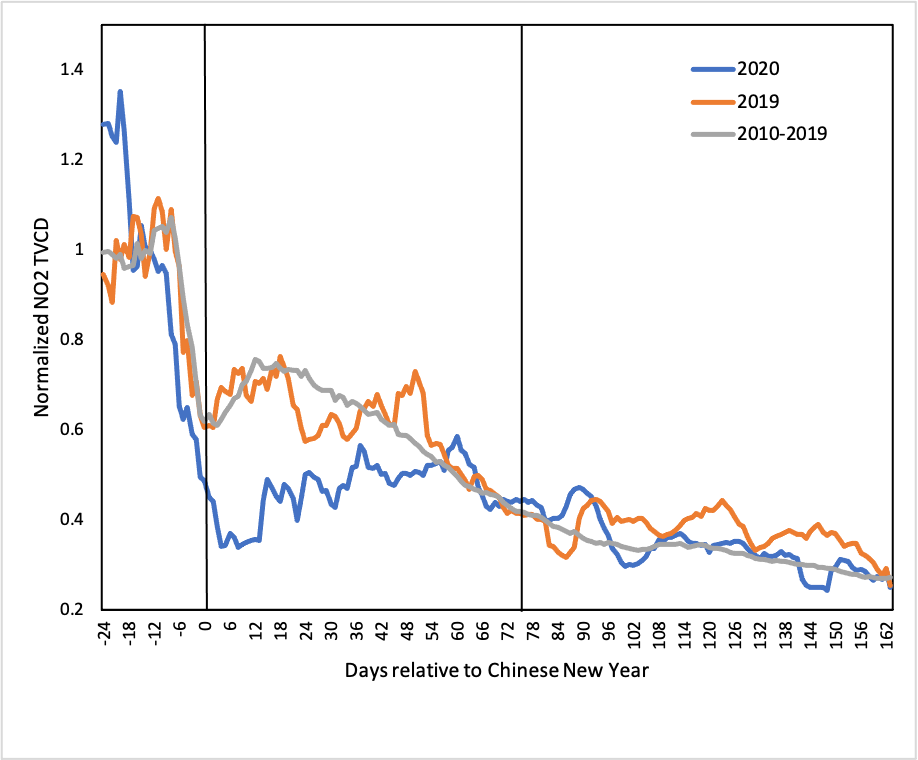 Figure 3. Daily variations in 7-day moving averages of the NO2 TVCD over China. The x-axis shows days relative to Chinese New Year. Points represent the midpoint of the 7-day interval. Values are normalized to the mean of the pre-period. The shadows represent standard errors. The two vertical lines divides the timeseries in to the pre-, peri- and post-periods.
In California, spatiotemporal patterns of air pollution were similarly influenced by the Covid-19 mitigation restrictions and reopening. The stay-at-home order generally reduced the concentration of air pollutants, and the reopening increased the emissions of air pollution back to a normal trend, as compared to previous years. NO2 emissions decreased over locations of major power plants and increased over populous residential areas.
The unprecedented global pandemic provides an opportunity to observe air pollution patterns with the shutdown of many human-based emission sources.
The unprecedented global pandemic provides an opportunity to observe air pollution patterns with the shutdown of many human-based emission sources. Through climatic analyses, studies can be done to investigate and project the impact of human activity in the atmospheric environment. We can and should set our sights on giving equal priority to economic rebound and climate control.
Photo via Getty Images