Mental Health on Campus
College students experience highs and lows. But with more than 10% of today’s students reporting suicidal thoughts, the lows have deepened.

Read Time: 6 minutes
Published:

Mental Health on Campus
College students experience highs and lows. But with more than 10% of today’s students reporting suicidal thoughts, the highest rate since the first widespread surveying on campuses, the lows appear to have deepened. College counselors point to growing stress and distress among students, with more than a third reporting that they have been diagnosed with a mental health condition, most often anxiety or depression, but also increasingly with eating disorders and forms of self-harm. There is considerable variation across schools, not explained by school size or competitiveness, but there remains a consistently higher prevalence of all mental health problems among students from lower socioeconomic backgrounds (financial stress is the most common risk factor) and among students with minority gender and sexual orientations.
While only a small proportion of students report they would think less of someone who has received mental health treatment, few avail themselves of such services. Only about half of students with apparent symptoms seek formal care. Too many prefer to deal with issues on their own or believe that they don’t have enough time to get help. Others question the seriousness of their needs, believing that overwhelming stress is normal in college or that problems will get better on their own. Stigma remains on campuses insofar as students don’t think their fellow students share attitudes as generous as their own toward those with mental health problems.
There is a clear-cut case for investment in campus mental health services: 30% of depressed students eventually drop out and research suggests that one-fifth of this drop-out rate can be averted by early intervention and treatment. Which means for every 500 incoming students, a robust mental health system would help 30 more students complete college, adding about $1 million in tuition to that school. Based on the cost of providing mental health services, for every $1 spent on such services, there is a $2 increase in school revenue.
This calculation presents only a narrow perspective. Since lifetime earnings follow from successful graduation, there is even greater value to an at-risk student if they are not derailed by a mental health problem during college. Screening and intervention programs are investments in academic achievement and will have downstream effects on the public’s health.
Untreated mental health problems are connected to every aspect of student life. The eating, sleeping, and drinking behaviors of college students continue to be maladaptive, leading to increased ill effects. Mental health service providers at and around campuses are busy. They should probably be busier.
Warmly,
Michael Stein & Sandro Galea

HOME-BASED HELP FOR QUITTING SMOKING
This smoking cessation intervention was delivered by public housing residents, who were trained as tobacco treatment advocates, to public housing residents who smoked. Advocates referred smokers to a Quitline, assisted smokers in obtaining nicotine replacement treatments, and made up to nine motivational visits. Participants at control public housing sites received basic smoking cessation information and counseling at a one-time visit. Smoking abstinence twelve months later was 16% in the intervention group and a surprisingly high 10% in the control group. Home visits by peer community health advocates can be effective for low-income public housing residents, a group with low rates of smoking cessation success. Which ingredients are necessary for such an intervention to be scaled cost-effectively remains to be seen.
SPEND LOCAL
If we spend more for public health activities at the local level can we lower overall disease burden and constrain medical spending in that community? Because many preventable health conditions accumulate with age, as the tolls of smoking, high blood pressure, and diabetes mount, public health spending might particularly decrease medical costs for older adults. These authors found that communities that increased local public health spending (that went toward health promotion targeting blood pressure and diabetes risk) experienced significantly lower Medicare expenditures in subsequent years, compared to communities where public health spending remained flat or declined. Medicare could recover an average of $1.10 for each dollar invested in public health activities after five years. An extended time horizon is needed to prevent disease rather than treat it among older adults, but public health investments could also save money on non-Medicare populations along the way.

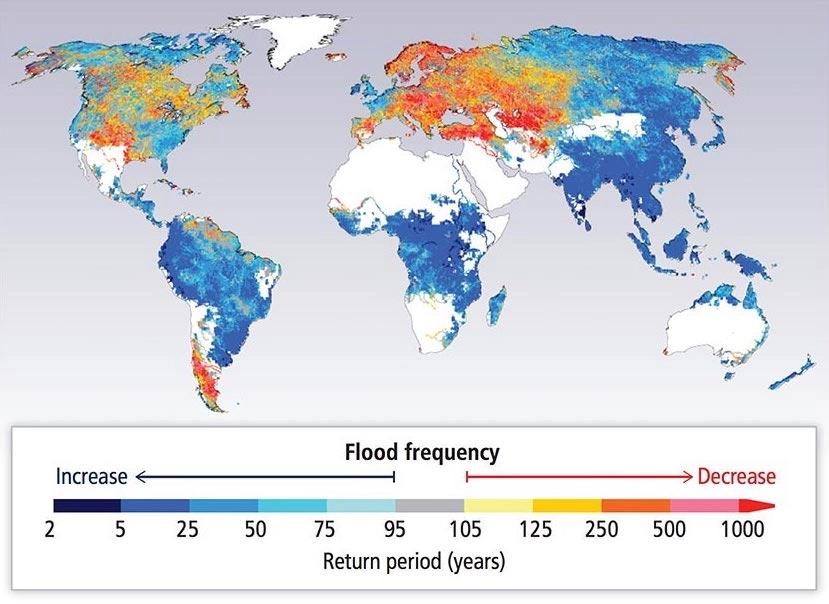
GLOBAL FLOOD RISK UNDER CLIMATE CHANGE
In a dark week of early September, in 2013, Colorado’s Front Range was hit with a 100-year flood. Over eight days, nineteen counties were flooded with a year’s-worth of rain water. Thick mudslides hauling large boulders destroyed thousands of homes, and basements were flooded with dirt and debris. Eight lives were lost. The flood was unprecedented, baffling meteorologists by its magnitude. In the face of climate change, flooding events such as these may become more frequent. Dr. Yukiko Hirabayashi and her research team calculated how flooding frequency around the world may change in the next 100 years.
The map above presents the global flood risk from rivers at the end of the 21st century. The research team used eleven climate models to calculate how floods with a discharge magnitude of a 20th century 100-year flood may occur in the 2080s. Areas of darker blue have a higher probability (lower return period) of a 20th century 100-year flood occurring within a given year. So, instead of these century floods occurring ‘once every 100 years’ (with a 1% chance of annual occurrence), they may turn into ‘decade’ or ‘half-century’ floods (every 10-50 years; with a 10%-2% chance of annual occurrence).
Globally, flood frequency is predicted to increase across 42% of the earth’s land regions. Select US states (Florida, Georgia, and Virginia) and the continents of South America, Africa, and Asia will need to prepare for extreme flooding every 2-50 years (a 50%-2% chance of annual occurrence). Between 27–93 million people are expected to be affected by flooding.
Areas expected to be most affected are low-income countries in the lower latitudes. These countries are, on average, more densely populated and less equipped to handle extreme weather than wealthier countries. As the world’s population is expected to increase, the impact of climate change on human populations will become dire. Governments need to focus on goals, such as those laid out by the Paris Climate Agreement, that reduce carbon emissions and prevent or mitigate the threat of future catastrophic flooding. —Erin Polka, PHP Fellow
Feature image: Intergovernmental Panel on Climate Change (IPCC) report, Chapter 3: Freshwater Resources, p. 248.