We’ve heard about ways to prevent deadly strokes: exercise regularly, maintain a healthy diet, avoid alcohol and smoking. Though stroke mortality rates in the US have decreased over time, where someone lives may increase their risk of dying from a stroke.
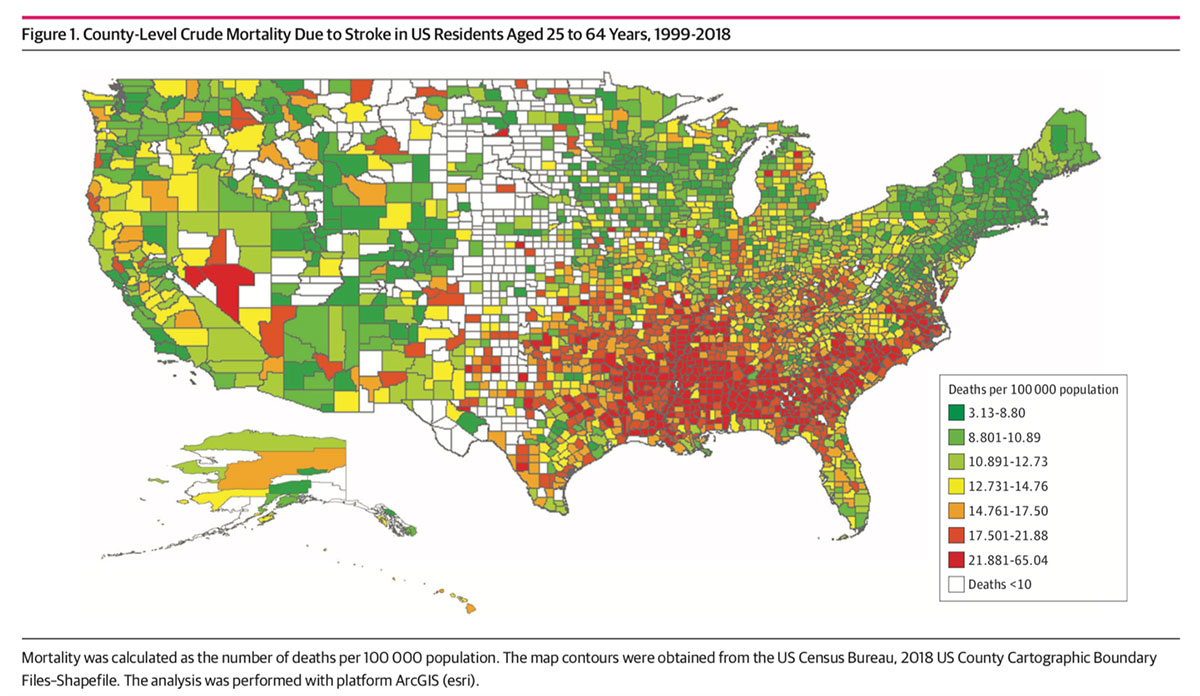
Suhang Song and team analyzed county-level stroke mortality between 1999 and 2018. During the study period, overall stroke mortality remained relatively stable. The red counties on the map show that death from stroke was greatest in the southeast US — an area often referred to as the “stroke belt” for its consistently higher rates of strokes compared to other areas of the country. Furthermore, the stroke belt is notched with inequity and cinches the issue of health disparities for marginalized people. Stroke mortality was most common in counties with a high percentage of Black or Asian residents, persons older than age 64, a high uninsured population, and low physical activity.
Stroke deaths occurring in the ER, out-of-hospital, and during emergency transport increased from 24% to 36% over the study period. The researchers speculate that this may be due to inefficient emergency transport in certain areas, poor access to high quality stroke care, or people’s inability to quickly recognize their stroke symptoms.
Of note, the county with the highest overall stroke mortality was 20 times greater than the county with the lowest rate — 65 deaths per 100,000 vs 3 deaths per 100,000.
County-level data allows for a detailed analysis of health trends that can be improved by local public health programs and policies. Stroke mortality will continue to reflect systemic inequities. until state-of-the-art care and efficient emergency transport are more accessible in areas with a high risk of death by stroke.
Databyte via Song S, Ma G, Trisolini MG, et al. Evaluation of Between-County Disparities in Premature Mortality Due to Stroke in the US. JAMA Netw Open. 2021;4(5):e214488.