Wastewater—sewage from homes, businesses, and treatment facilities—can be used to track diseases and predict outbreaks.
Wastewater surveillance technology has been especially useful when comparing COVID-19 trends across neighborhoods. During the pandemic, the Centers for Disease Control and Prevention’s National Wastewater Surveillance System monitored wastewater facilities by region. The applications of this technology used changed how we now look at our wastewater and what this means for our health.
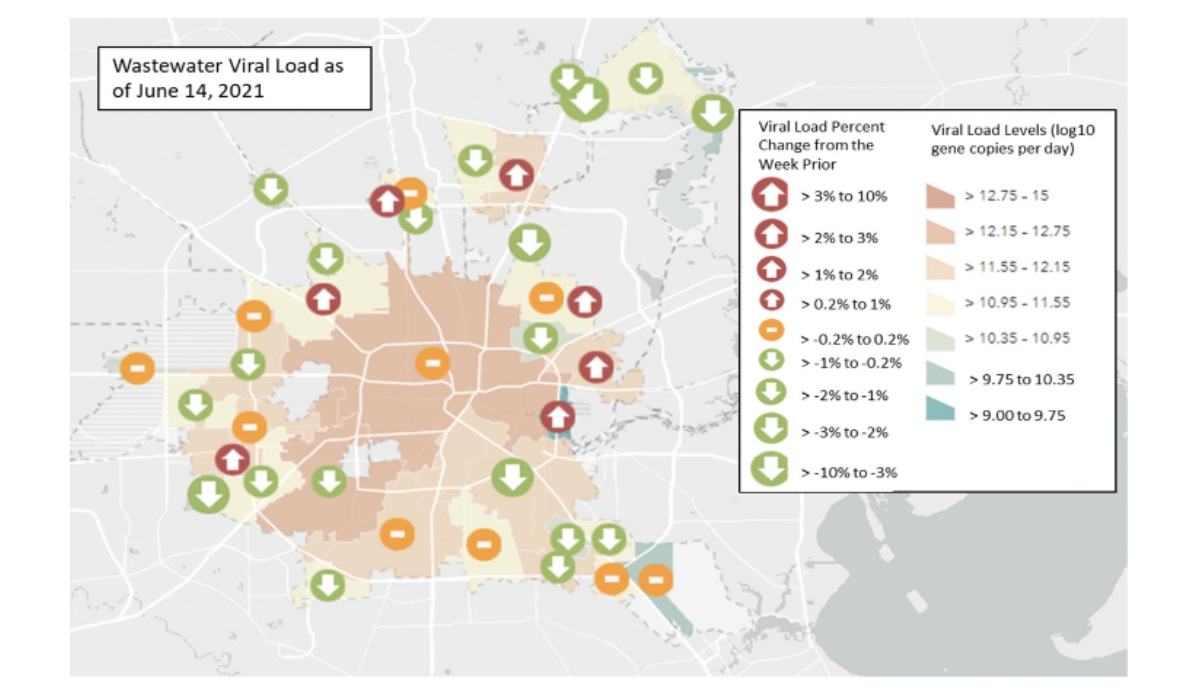
The results from the above map of Houston, Texas shows monitored locations on a single day in June 2021. The map, part of a National Academies of Sciences, Engineering, and Medicine consensus study report, displays spatial variations of COVID-19 burdens. It offers a snapshot of the viral load (i.e., how much virus is in a community) in data across 39 wastewater treatment plants.
Areas marked with green arrows pointing down show increased viral loads (i.e., more persons infected) since the prior week, while red arrows pointing up indicate decreased viral loads (i.e., fewer people infected). The yellow, single dashed lines represent no observed changes. Larger sized arrows indicate the higher magnitude of the trend. The different colors on the map show the log10 gene copies, a standard way of describing changes in viral load levels.
Because a rising viral load often antedates symptomatic illness, wastewater surveillance technology helps policymakers and public health emergency response teams know where to allocate resources before an outbreak emerges and requires emergency care.
Databyte via National Academies of Sciences, Engineering, and Medicine. Wastewater-based Disease Surveillance for Public Health Action. 2023.