The goal of the Affordable Care Act (ACA) was to expand health care coverage, creating the closest thing to universal coverage the United States has ever seen. Many states increased coverage among previously uninsured residents by expanding Medicaid eligibility. Thirty-three states and the District of Columbia have expanded Medicaid and three more are considering expansion. The thirteen remaining states are not obligated to do so, due to a Supreme Court ruling that mandatory expansion is unconstitutionally coercive.
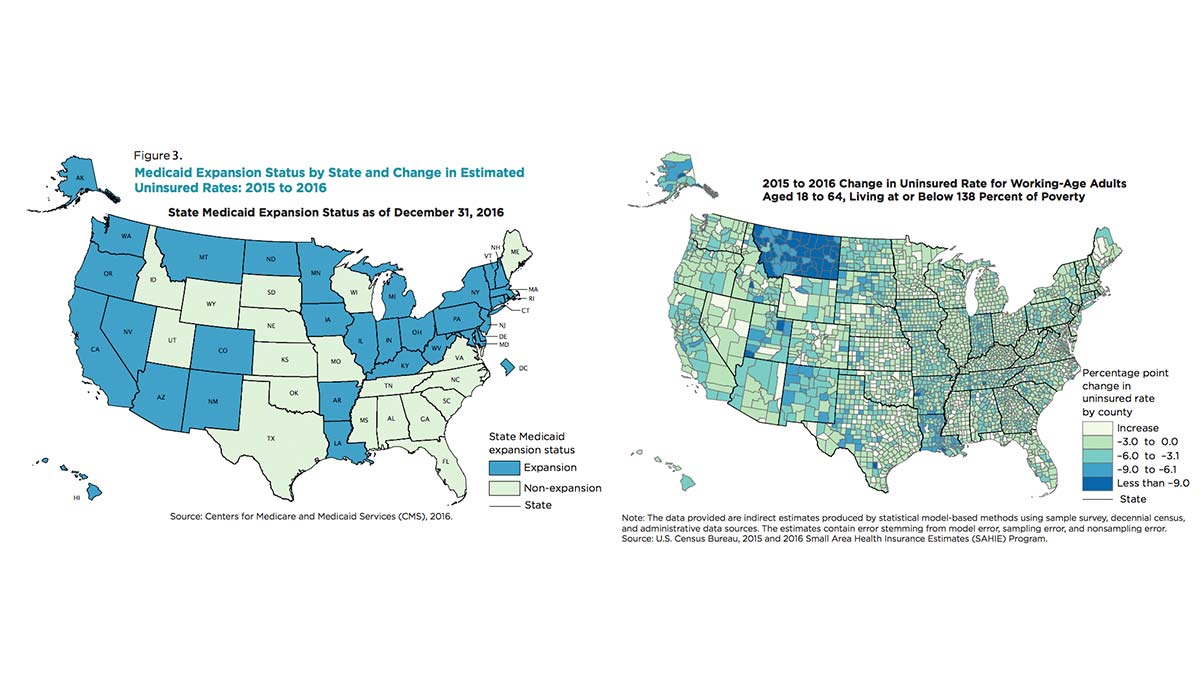
A report published in 2018 by Bowers, Gann, and Upton, summarizes data from the 2016 US Census Bureau’s Small Area Health Insurance Estimates program. In the map on the left, states that expanded Medicaid coverage between 2015-2016 are blue. The map on the right, shows health care coverage for low-income individuals by county. Dark blue shows that more new people were covered by health insurance out of the total potential population. In states that expanded Medicaid, 23.4% of counties saw a decrease in their estimated uninsured rates (350 counties out of 1,498). This change is substantially larger than the 5.6% decrease in states that did not expand Medicaid eligibility (92 counties out of 1,643).
Within states that expanded Medicaid, the umbrella of coverage widened through the contribution of Federal Subsidies, allowing for almost 12,000 newly-eligible Americans to gain coverage.
Databyte via Lauren Bowers, Carolyn Gann, and Rachel Upton, Small Area Health Insurance Estimates: 2016. United Status Census Bureau.