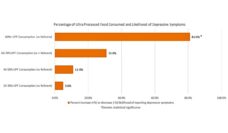
Health organizations support using taxes to make unhealthy products less affordable. Advocates point out that sugary drinks are a major source of sugar in the average person’s diet. And overconsumption of sugar contributes to the development of obesity, diabetes, and other chronic health concerns – so a tax should discourage the buying and drinking of these beverages, right?
Research suggests yes. For example, following their tax, Berkeley, CA saw decreased sugar-sweetened beverage consumption. Now, residents of eight other cities across the country also have to pay a local tax on sodas.
However, critics remain skeptical, pointing out that consumers can find equally sugary replacements to drink.
In response, Philadelphia, PA implemented a tax in 2017 targeting any non-alcoholic beverages that use sugar or artificial sweeteners. It includes both sugar-sweetened and artificially-sweetened beverages, such as diet, low-sugar, or zero-calorie drinks. By the end of 2017, sales volume for both had fallen significantly.
The question now is whether the changes are sustainable as the tax continues.
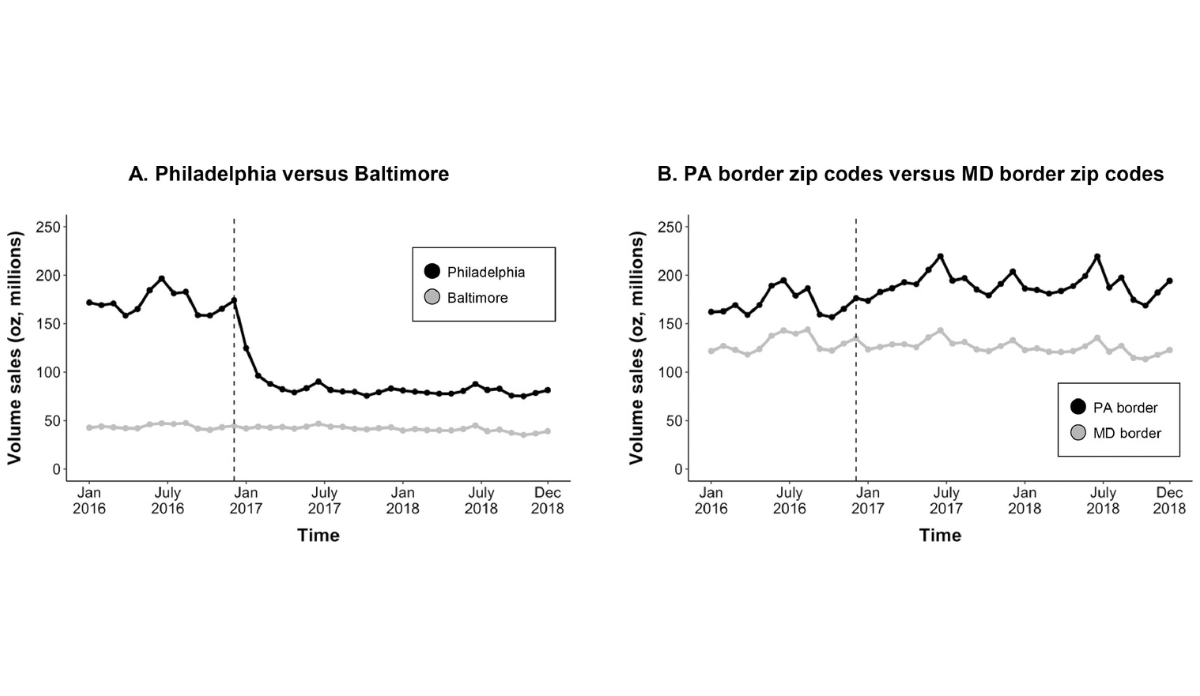
To quantify long-term changes, Joshua Petimar and colleagues examined volume sales in Philadelphia 1 year before (2016) and 2 years after implementation of the tax (2017 & 2018). They compared data from Baltimore, MD, which has a similar population but no beverage tax. They also included zip codes bordering both cities, to capture where people might have gone shopping to avoid the tax.
The figure above demonstrates that volume sales in Philadelphia decreased by 50% after the tax was implemented (dashed line) and remained at this lower level through 2018. Sales in Baltimore stayed steady throughout the same period.
The figure also shows that volume sales in zip codes bordering Philadelphia increased by 16%, suggesting cross-border shopping for sweet drinks. After accounting for this possibility, the authors estimated that overall volume sales decreased by 35% following Philadelphia’s tax.
Philadelphia’s comprehensive tax on all sweetened beverages has demonstrated consistent changes in consumer behavior, but it’s still early to know about other dietary changes and consequent health outcomes.
Databyte via Joshua Petimar, Laura A. Gibson, Jiali Yan, et al. Sustained Impact of the Philadelphia Beverage Tax on Beverage Prices and Sales Over 2 Years. American Journal of Preventive Medicine, 2022.