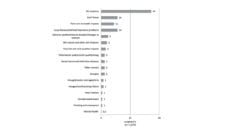
If our energy use continues to increase at the current rate and pace, our planet is predicted to heat up by an average of 2˚C (3.6˚F) by 2040. Using data gathered from NASA and Scripps Institution of Oceanography, Vox created a Weather 2050 map to demonstrate how temperatures across US cities will change over the next three decades.
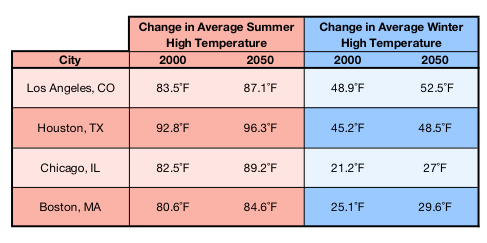
The table below summarizes dramatic temperature increases predicted for US cities, leading to hotter summers and warmer winters. Temperature is both a reflection of and a main driving force behind climate. Warmer temperatures lead to warmer air, which leads to more evaporation and increases the amount of water vapor (precipitation) in the atmosphere. Together, precipitation and temperature impact climate patterns, causing water scarcity and drought in dry arid areas, and more extreme precipitation events in areas that are humid and moist.
Fires are expected to increase, in frequency and intensity, as temperatures rise in hot and dry places. Western states, which are already experiencing devastating wildfires, can expect to see longer wildfire seasons. Between January to November in 2018, the US experienced over 52,000 wildfires that devastated 8.5 million acres of land and destroyed over 20,000 structures in California alone. Wildfires cause deaths, respiratory and mental health disorders, and increase pollution. Fire smoke and pollution increase the risk of low infant birth weight, worsen asthma, and raise the risk of stroke.
Areas along the Southern coast can expect to see increased intensity of hurricanes, as warming temperatures slow storm movement and increase rainfall. In 2017 Hurricane Maria hit Puerto Rico, causing catastrophic damage as it slowly trudged across the island at 9 mph, killing thousands of people and leaving large parts of the island without power for over a year. Drownings, residential displacement, increased mental stress, and vector-borne diseases are all hurricane-related health impacts that will intensify in the oncoming years.
Although most winters will become shorter, blizzards will intensify. In humid areas like Boston, warmer temperatures will evaporate more water in the air, increasing the intensity and longevity of nor’easters.
The summertime, however, is when we can expect to see the most damage. Heat waves are the number one predicted threat to city-dwelling residents, and cities in the Northeast can expect to see the greatest increases in temperature compared to the rest of the United States. Heat waves impact vulnerable populations the most, such as infants, the elderly, and homeless populations, who are less able to cool their core body temperatures at night and have less access to air conditioning. Heat waves cause dehydration, heat stroke, and death; they are a silent and unseen killer, as individuals often die alone, and cause of death is usually attributed to ‘stroke’ rather than ‘heat.’ Heat waves also increase the risk of causing a blackout from widespread use of AC units, placing whole cities at risk.
There is little question at this point that global temperatures will rise by 1.5˚C over the next decades, but do they need to go up as much as 2˚C by 2040, our ‘worst case scenario’ climate scenario? As individuals, there are actions we can take in addition to voting for environmentally-sustainable policies and the candidates who promote them. To reduce our carbon footprint and help prevent temperatures from increasing, we can invest in renewable energy, reduce our meat and animal consumption (especially beef and lamb), commute via ride share or public transportation, and incorporate sustainable practices into our everyday lives by turning off lights, turning down our heat, turning off our AC, and recycling.
It’s obvious what the public health implications of inaction are. If we don’t change course, our worst case scenario will become our daily life.
Feature image: Patrik Theander, Matches, used under CC BY-SA 2.0