Most Americans are familiar with the graphic dietary guidelines produced by the United States Department of Agriculture (USDA), including the notorious ‘food pyramid.’ In 2011, the USDA’s food pyramid model evolved into its successor, MyPlate. The concept of MyPlate is that Americans can visualize a proportionally balanced meal as it would typically be served on a plate. The concept also emphasizes the importance of consuming whole, as opposed to processed, foods.
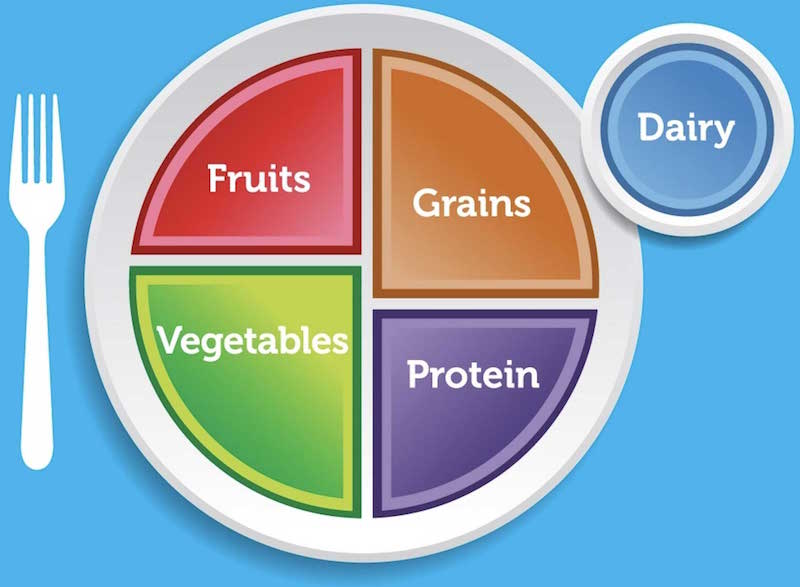
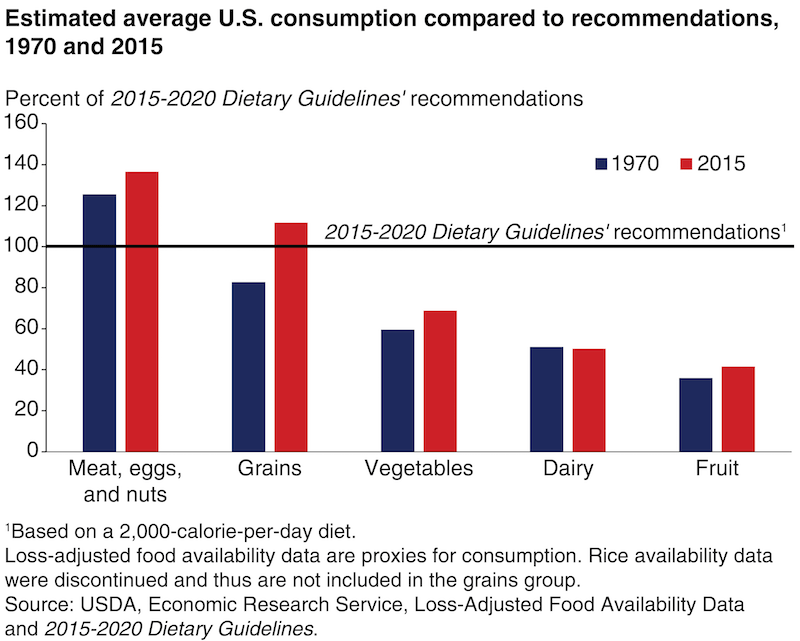
The USDA MyPlate recommendations call for half of our diets to consist of fruits and vegetables. This recommendation is sensible, as fruits and vegetables contain antioxidants, phytonutrients, fiber, and other beneficial properties that are associated with preventing lifestyle diseases such as stroke and diabetes. However, studies show that Americans consume less than 50% of the USDA dietary recommendations for fruits and less than 75% for vegetables. Conversely, Americans over-consume proteins and grains, obtaining the majority of their calories from these sources as well as from added fats and sugars.
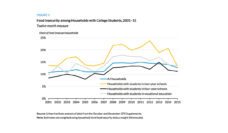
Having a low-income is a barrier to purchasing fruits and vegetables for a variety of reasons. First, living in low-income neighborhoods and minority communities increases access to processed and fast foods. Second, energy-dense foods, including those that are highly processed, are consistently less expensive than low-energy dense foods such as fresh produce. Although the importance of food costs and convenience are more important to people with low incomes compared to those with higher incomes, the importance of nutrition does not seem to vary by income level. Thus, it is more difficult for Americans who have a smaller grocery budget to eat in accordance with USDA dietary recommendations, even if they do express interest in eating fruits and vegetables.
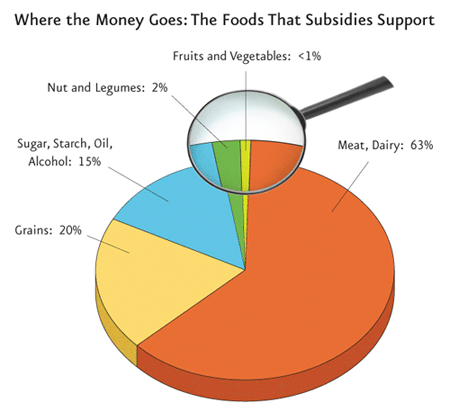
We may expect that the USDA is striving to reduce produce prices. However, despite the USDA having distributed $246 billion in subsidies to food industries between 1995-2009, less than 1% of those funds were issued to fruit and vegetable production combined. Ironically, 63% of federal food subsidies support animal agriculture and 20% support grain production, even though meats (deemed as part of MyPlate’s protein group) and grains are consumed in excess by Americans. Despite MyPlate’s encouragement of whole food diets and Americans’ overconsumption of added fats and sugars, a combination of sugar, starch, oil, and alcohol production receive 15% of USDA-granted subsidies.
While it may not be realistic to drastically cut the subsidies provided to heavily funded industries, the USDA should subsidize industries at a proportion that more closely matches the recommendations for consumption. Providing larger subsidies to fruit and vegetable farmers could lower produce costs to consumers. Affordability would allow more Americans to purchase and consume fruits and vegetables, regardless of income status.
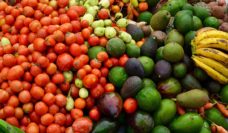
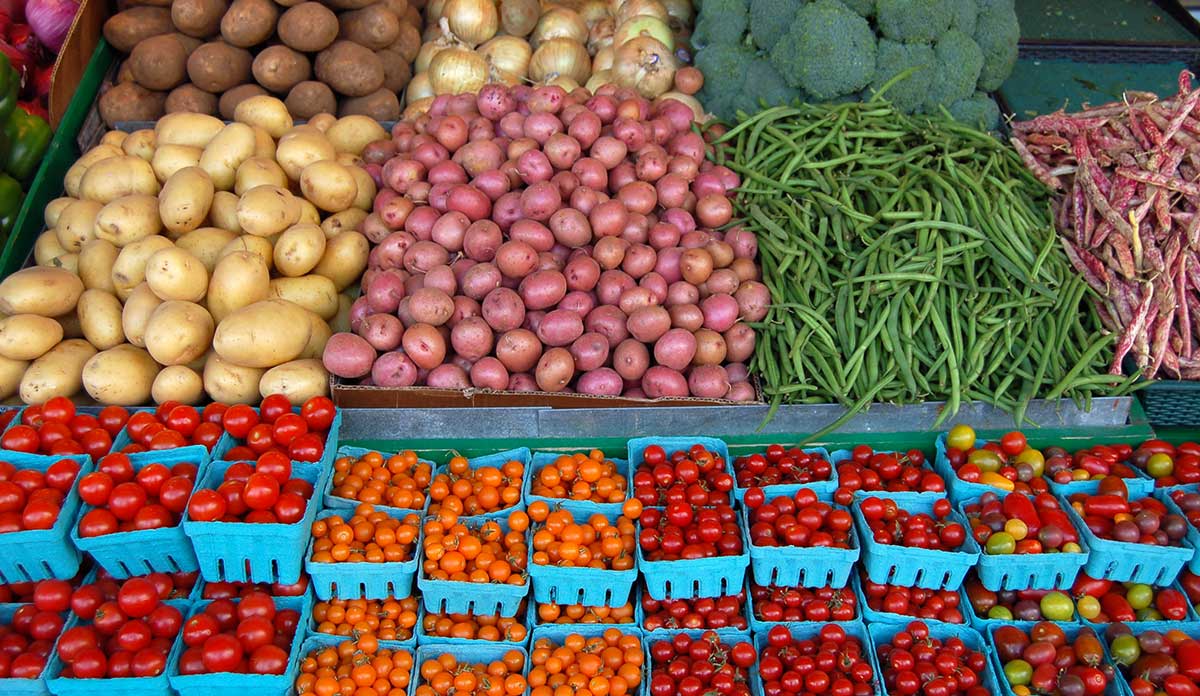
Feature image: Jason Wolff, Open Market Produce, used under CC BY 2.0. Graphic from Choose MyPlate.gov. Chart comparing U.S. consumption to USDA dietary recommendations from USDA Economic Research Service. Food subsidies pie chart from Physicians Committee for Responsible Medicine.