Rating Health After Redlining
Redlining, a vehicle of structural racism, is associated with slower neighborhood foreclosure recovery and poorer self-rated health among Detroit residents.
Read Time: 3 minutes
Published:
A long history of discriminatory housing policies in the US has led to deeply rooted discrepancies in neighborhood conditions that shape people’s health. Elizabeth McClure and colleagues recently examined the relationship between changes in home foreclosure rates following the 2007–2008 recession and residents’ self-rated health in Detroit. The study also considered how the relationship between self-rated health and foreclosure was affected by the impact of historical redlining practices.
“Redlining” is a practice of systematic discrimination where mortgages and loans are denied because of race/ethnicity and location. The term came about because lenders would actually draw a red line on a map around the neighborhoods they refused to invest in. Lenders outlined neighborhoods in over 200 American metropolitan cities like Detroit in the 1930s. Areas were color-coded similarly to the map below: green for “best,” blue for “still desirable,” yellow for “definitely declining” and red for “hazardous.” Redlined neighborhoods, largely inner-city areas populated by Black families, were the neighborhoods lenders regarded as credit risks and where mortgage insurance was denied. This practice guaranteed that Black families and other people of color were blocked from purchasing homes, building wealth, and moving into new suburban, high-resourced communities. After the New Deal, redlining was later used by the Federal Housing Administration and the Veterans Administration.

McClure’s study collected demographic and health data from 1,400 Black Detroit residents annually between 2008 and 2013. All study participants lived in historically redlined areas of the city. They were asked to rate their health by answering the question, “In general, would you say your health is: excellent, very good, good, fair, or poor?” Neighborhood foreclosure recovery, defined as the reduction in neighborhood foreclosure rate following the 2007-2008 recession, was obtained using data from an online marketplace for foreclosed properties. Home foreclosure rates were calculated as the number of foreclosed properties divided by the number of owner-occupied residences in each year.
A history of redlining was associated with slower neighborhood foreclosure recovery and poorer self-rated health among Detroit residents.
In 2008, 27% of study participants reported poor health. By 2013, this proportion increased to 33%. The researchers found that areas with slower foreclosure recovery had a higher prevalence of residents with poor self-rated health. A history of redlining was associated with slower neighborhood foreclosure recovery and poorer self-rated health among Detroit residents.
Redlining, a vehicle of structural racism, has complicated the relationship between neighborhoods and health in Detroit. While “residential security” maps were not solely responsible for segregating neighborhoods and forming inequitable cities, redlining was instrumental in creating many of the poorest neighborhoods we see decades later.
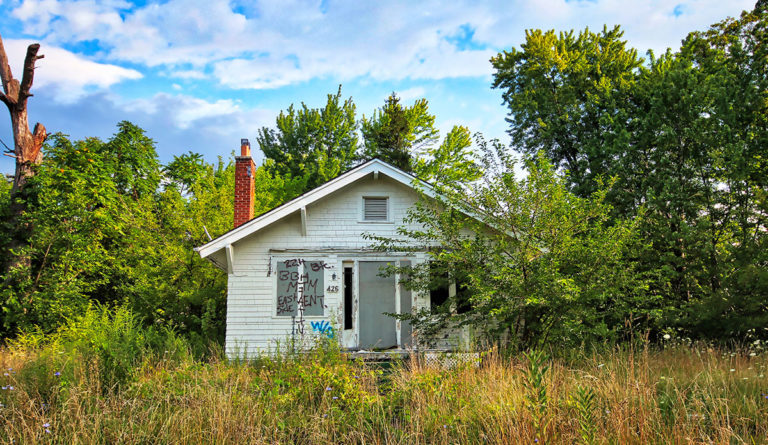
Photo by Daniel Tuttle on Unsplash