Environmental justice (EJ) is the fair treatment and meaningful involvement of all people with respect to environmental policies and the right for communities to live, work, play, or worship in a safe and healthy environment. As academic researchers, we can incorporate EJ in different ways.
One involves actively working with a community by listening to and conducting research that responds to community needs and priorities. Another approach identifies communities that are most impacted by environmental health disparities and investigates ways to eliminate and reduce environmental injustice. An example of this is working to reroute truck traffic away from a low-income community identified as having elevated risk of lung cancer from exposure to diesel exhaust. A community-driven EJ mapping project is one way to incorporate both approaches.
A workgroup was formed in 2018 as a result of resounding concern over the impacts of climate change on environmental health in Washington state. Community organizations, academic researchers, and staff from government agencies came together to explore building a tool that would pinpoint on a map those communities that are most impacted by environmental hazards.
The working group was initiated by Front and Centered, an EJ coalition of organizations rooted in communities of color. Participating organizations included Puget Sound Sage, University of Washington Department of Environmental and Occupational Health Sciences, the Washington State Department of Health (DOH) Washington Tracking Network (WTN) program, the state’s Department of Ecology, and the Puget Sound Clean Air Agency, a regional air quality management agency.
The two-year process culminated with the Washington Environmental Health Disparities Map. The online, interactive tool maps environmental exposures and population characteristics that increase community vulnerability and ranks the relative environmental health disparities of communities across the state. It incorporates 19 environmental and population indicators at the census tract level.
As the Washington Environmental Health Disparities Map is integrated into other state policy and programs, the map can provide opportunities to address these disparities in consultation with the affected communities.
What makes this map in Washington state case different from other mapping efforts? This map was created through direct input from the communities already impacted by environmental health disparities. There are also ongoing efforts of various groups to use the map in new policies that lie at the intersections of climate justice and environmental health. The map provides an evidence-based foundation for the public, agencies, policymakers, and community-based organizations to allocate resources or prioritize an issue.
As an example, in 2019, the Governor’s Interagency Council on Health Disparities created an Environmental Justice Task Force. The goal is to improve health outcomes of Washingtonians by incorporating EJ principles into state agency actions. The work of the Task Force is directly tied to the map. They will recommend ways state agencies can focus their work towards reducing disparities identified through the Washington Environmental Health Disparities Map and building meaningful community engagement.
Another example is Washington’s 2019 Clean Energy Policy, which mandates that state utilities transition to 100% clean and renewable electricity by 2045. The map may have a role in this initiative, too. The bill discusses the use of cumulative impacts mapping to identify communities that are most highly impacted by fossil fuel pollution and climate change. Community engagement that follows the mapping project’s framework will ensure that these communities benefit from public health and environmental benefits while being protected from the costs and energy security risks of the law.
As the Washington Environmental Health Disparities Map is integrated into other state policy and programs, the map can provide opportunities to address these disparities in consultation with the affected communities.
As academic researchers, we will continue to follow the evolution of the tool and its role in strengthening partnerships and fostering dialog between communities and state agencies, especially as community conditions change over time. At the same time, we can continue our work listening to communities and looking for opportunities to incorporate new indicators into the tool that helps to better map and address disparities.
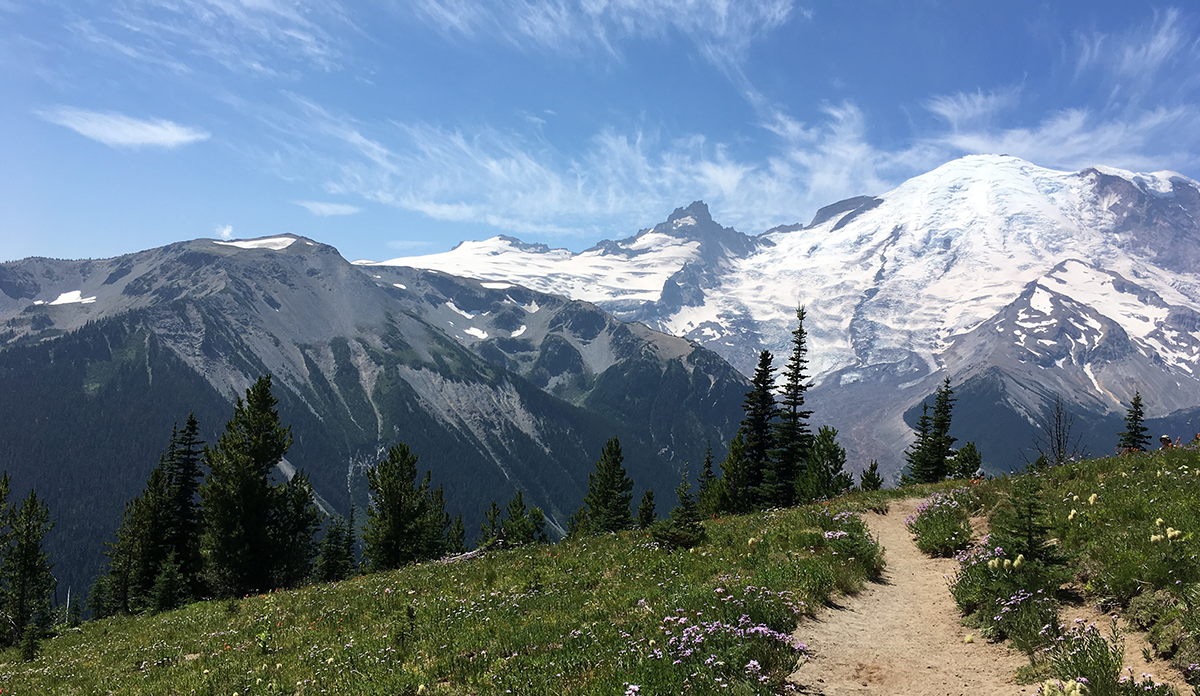
Photo by Stephanie Bergeron on Unsplash