What Works for HIV
San Francisco has focused on prevention and treatment efforts to decrease the number of HIV diagnoses and AIDS deaths, informing future HIV responses.
Read Time: 2 minutes
Published:
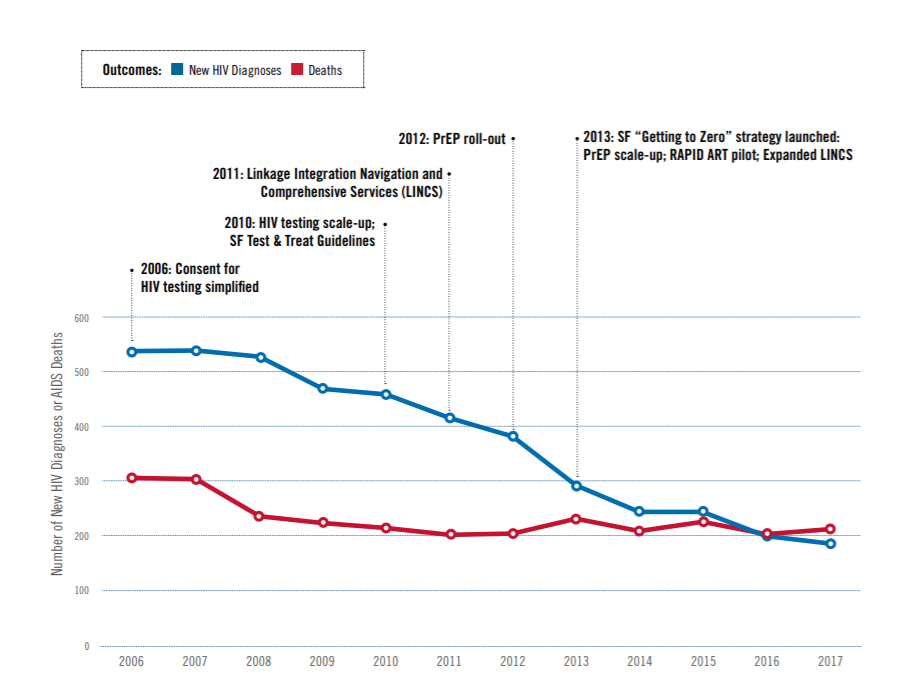
New data from San Francisco are informing the future of the HIV response. As illustrated in the graph, HIV diagnoses (in blue) decreased from over 500 in 2006 to below 200 in 2017. AIDS deaths (in red) decreased from 300 in 2006 to 200 in 2017. San Francisco has focused on prevention efforts like simplifying consent for HIV testing, expanding access to pre-exposure prophylaxis medications, and starting treatment regardless of CD4 level for those with infection to reduce the possibility that they could transmit HIV if they have unsafe sex.
These successful public health interventions at the city level now serve as examples for interventions nationally. In Ending the HIV Epidemic: A Plan for America, a coalition of federal government agencies rolled out policy and programming with interventions similar to San Francisco.
“When we were putting together the plan to end the epidemic in the United States, one of the key issues that we struggled with, because it’s such an important challenge, is how do you translate a San Francisco model to not only Atlanta but to rural, southern states,” said Dr. Anthony Fauci, Director of the National Institute of Allergy and Infectious Diseases. “The answer is easy. How to get there is difficult.”
In the southeastern US, 16.1 per 100,000 people were diagnosed with HIV compared to 10.6, 9.4, and 7.4 in the Northeast, the West, and the Midwest, respectively.
Databyte via Translating Progress into Success to End the AIDS Epidemic, 2019.