Most U.S. social welfare programs rely on the Federal Poverty Line (FPL; formally the US Federal Poverty Guideline) to assess poverty status or set income eligibility thresholds. The FPL is critical to the administration of entitlement programs like Social Security, means-tested programs like Temporary Assistance for Needy Families (TANF), and eligibility determinations for insurance subsidies under the Affordable Care Act. Congressional leaders like Paul Ryan and Mitch McConnell have voiced their intention to seek a wide range of retrenchments in these and other social welfare programs when Congress convenes in 2017, and those changes will inevitable rely on and refer to the FPL as they seek to reduce the reach of the U.S. welfare state.
Deep poverty is often defined as income below 50% of the FPL – that’s less than $5,940 for an individual.
So what exactly is the FPL? It’s an annually adjusted income threshold used to identify American households living in poverty. In 2016, the FPL for a single individual was $11,880 in annual income. Quadrupling household size to a family of four just barely doubles the poverty guideline to $24,300. This is not very much money. Policymakers debate about if and how the guideline should be calculated differently, but any changes are likely to increase the number of people identified as living in poverty. People living near the threshold of the poverty guideline face numerous struggles which are not to be lightly dismissed – off hand we know experiencing poverty is linked to a wide range of short- and long-term consequences such as malnutrition, poor health, poor educational outcomes, unemployment, homelessness, and socio-emotional challenges.
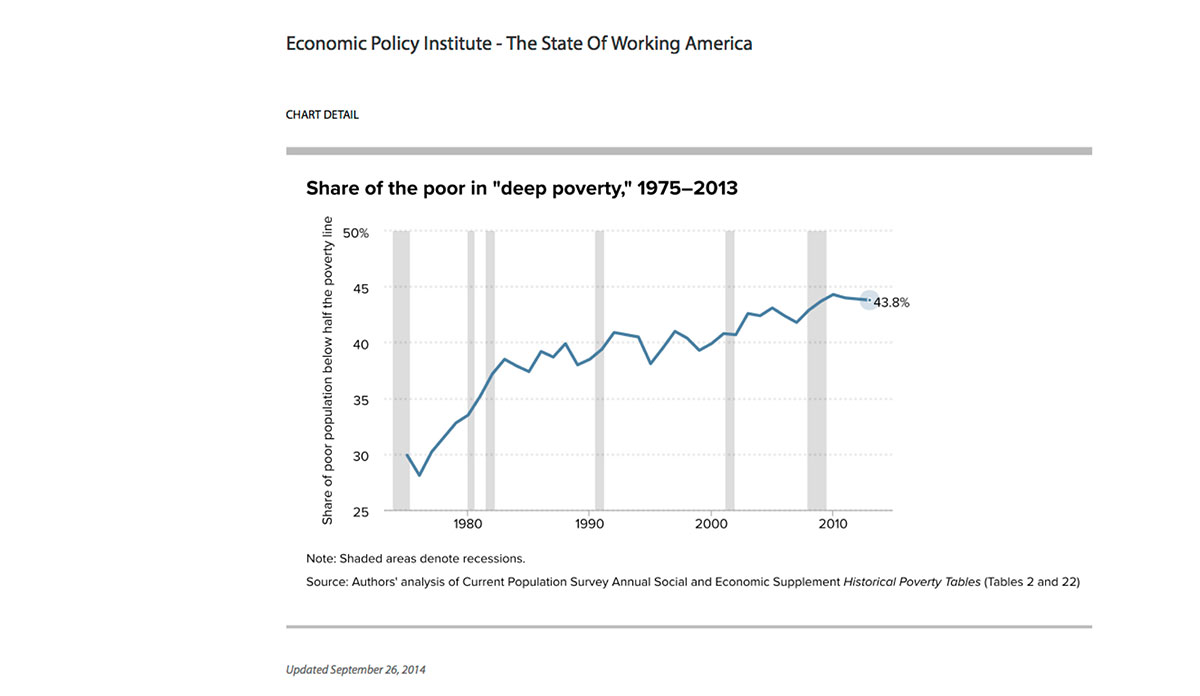
Now consider all of those risks and the difficulty of escaping poverty faced by those living far below the poverty line. Deep poverty is often defined as income below 50% of the FPL – that’s less than $5,940 for an individual. Not only is deep poverty a profoundly unstable and difficult place to be, it is also increasingly steadily. The Economic Policy Institute’s State of Working America project tracked the percentage of the American poor living in deep poverty, and as is evident below, that proportion has increased significantly in the last four decades, from a low of 28.1% in 1976 to a high of 44.3% in 2010, which has edged down just slightly to 43.8% in 2013. The poor are getting poorer at an alarming rate.
Databyte via The State of Working America, an ongoing analysis published since 1988. Economic Policy Institute.