Pundits are still debating how Donald Trump came to occupy the Oval Office. Jacob Bor of the Boston University School of Public Health, in a recent American Journal of Public Health article, provides a different way of examining what happened. He demonstrated a striking relationship at the county level between health status and how people voted in the 2016 president election.
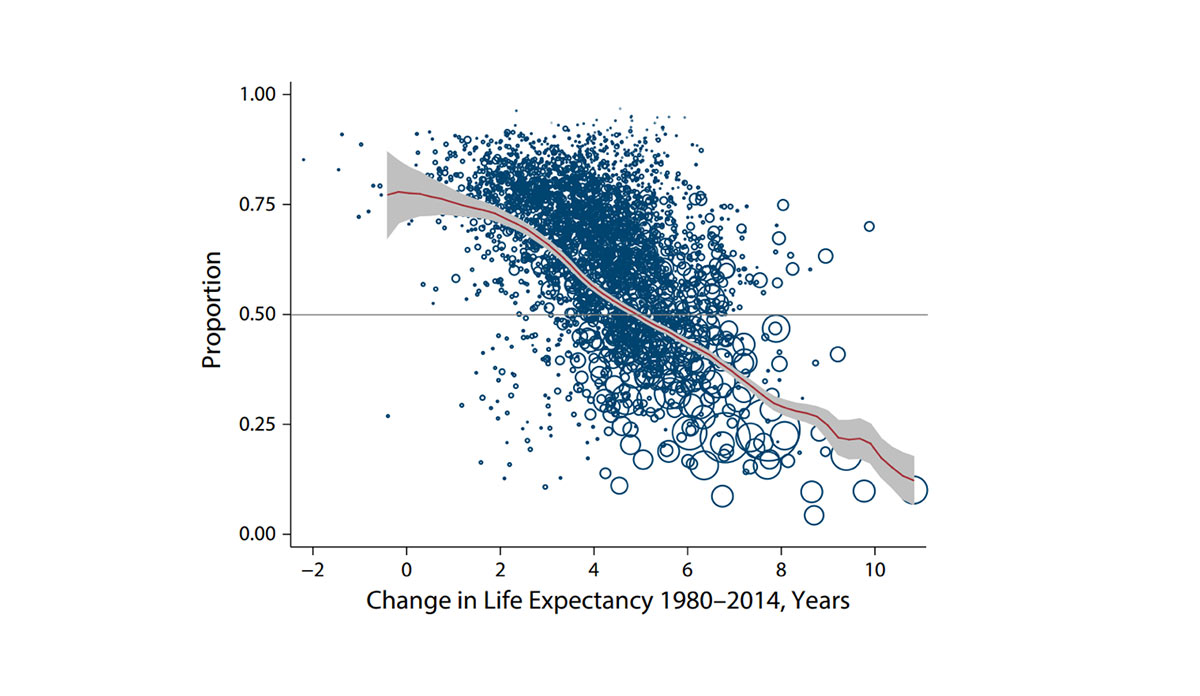
Bor assessed the association at the county level between life expectancy changes from 1980-2014 and voting patterns in 2008 and 2016. He used multivariable regression to control for characteristics such as which state people were from, percentage with a college degree, income inequality, and race/ethnicity.
The results showed that voters in areas that experienced stagnated or declining life expectancy between 1980 and 2014 were “much more likely to vote for Trump…” Life expectancy increased nationally during these years, yet Bor writes: “…residents of many counties voting for Trump have been left out of the broader life expectancy gains of the past 3 decades.” There is no reason to think it will get better under Trump who has proposed cuts to health insurance for the poor and food stamps.
Bor’s results echo what we have seen in specific states when the poorest and least healthy areas vote for the candidate promising to undo spending on social services aimed at health. Thomas Frank wrote about this phenomenon in What’s the Matter with Kansas? Perhaps the sequel should be titled “What’s the Matter with America?”
Databyte via Jacob Bor, Diverging Life Expectancies and Voting Patterns in the 2016 US Presidential Election. American Journal of Public Health (AJPH).