The Vanishing Marginals
Democrats may win the presidency and the Senate but have almost no chance of winning the House. Only 18 of 435 House seats are considered toss-ups. Why?
Read Time: 3 minutes
Published:
One of the unique features of the U.S. House of Representatives is that every single seat is on the ballot every two years. This stands in stark contrast to the Senate where each term lasts for six years and American voters had no direct role in electing senators until the 17th amendment was adopted in 1913. The House is meant to be the people’s house, a reflection of the mood of the country.
But as Americans go to vote today, only 18 House seats are projected to be true toss-ups. Another seven are projected to lean Democratic and another 12 are projected to lean Republican. This means that 398 of the 435 (or 91%) of the seats in the House are pretty safe for one party or the other. The map overwhelmingly favors Republicans such that there is virtually no chance Democrats will win control of the House even if Hillary Clinton wins the presidency and Democrats win the Senate.
In fact, a majority of voters could choose a Democrat to represent them in the House and Republicans could still comfortably retain control. This happened in 2012 when Democrats won 50.6% of the House vote but just 46% of the House seats. These four percentage points make a big difference, giving Republicans 234 seats in the House compared to 201 for Democrats. This meant that Republicans decided who would chair committees, controlled the agenda, and could pass their legislation even if they were not totally united (which they weren’t).

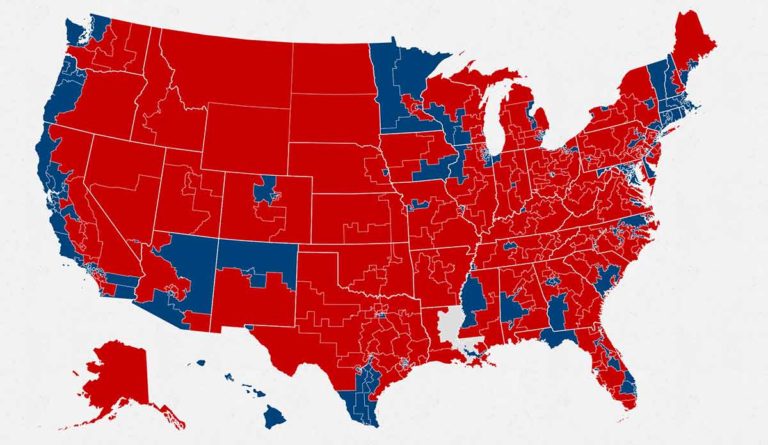
Photo via Nate Silver, As Swing Districts Dwindle, Can a Divided House Stand?. New York Times.
A similar thing happened in 2014 when Republicans won 52% of the vote in House races but 57% of the seats. Today’s databyte (above) shows that 2012 and 2014 were not flukes. The number of competitive House seats has been steadily decreasing for decades. Political scientists David Mayhew and Morris Fiorina wrote about this in the 1970s, calling it the “case of the vanishing marginals” because the margin of victory for incumbents has been getting larger and larger.
But why does this trend favor Republicans? Democrats have historically had a stronghold on the House. Democrats controlled the House for 46 of the 50 years between the end of World War II in 1945 and the Gingrich revolution in 1994. Republicans have controlled the House for 18 of the 22 years since.
The key election for entrenching Republican control of the House was in 2010 when the Tea Party wave gave Republicans unprecedented majorities in 26 state legislatures and at least partial control in another 8. This was hugely consequential because 2010 was a census year when the congressional district boundaries were re-drawn. The legislature has significant control over redistricting in 42 states, giving Republicans a huge advantage in drawing boundaries that increase their chance of victory.
This favorable map combines with an astronomical incumbency rate—90% of House incumbents of either party who sought re-election in 2012 won their race—to give Republicans a major head start in every election. These two dynamics have important implications for how Congress governs. The biggest political threat to most Members of Congress is not someone from the other party but a more extreme person in their own party. Democrats and Republicans therefore have an incentive to be even more strident and even less incentive to cooperate or compromise. Changing how districts maps are drawn would not automatically change the tone of U.S. politics, but it is where I would start.
Databyte via 2014 House of Election Results. Politico.